
Stop Guessing.
Start Predicting.
Get clear visibility into occupancy, overtime, and margin trends, spot outliers early, and put staffing, census, and financial data in one place your team can act on.
Predictive Staffing
Occupancy Analytics
AI-Powered Insights
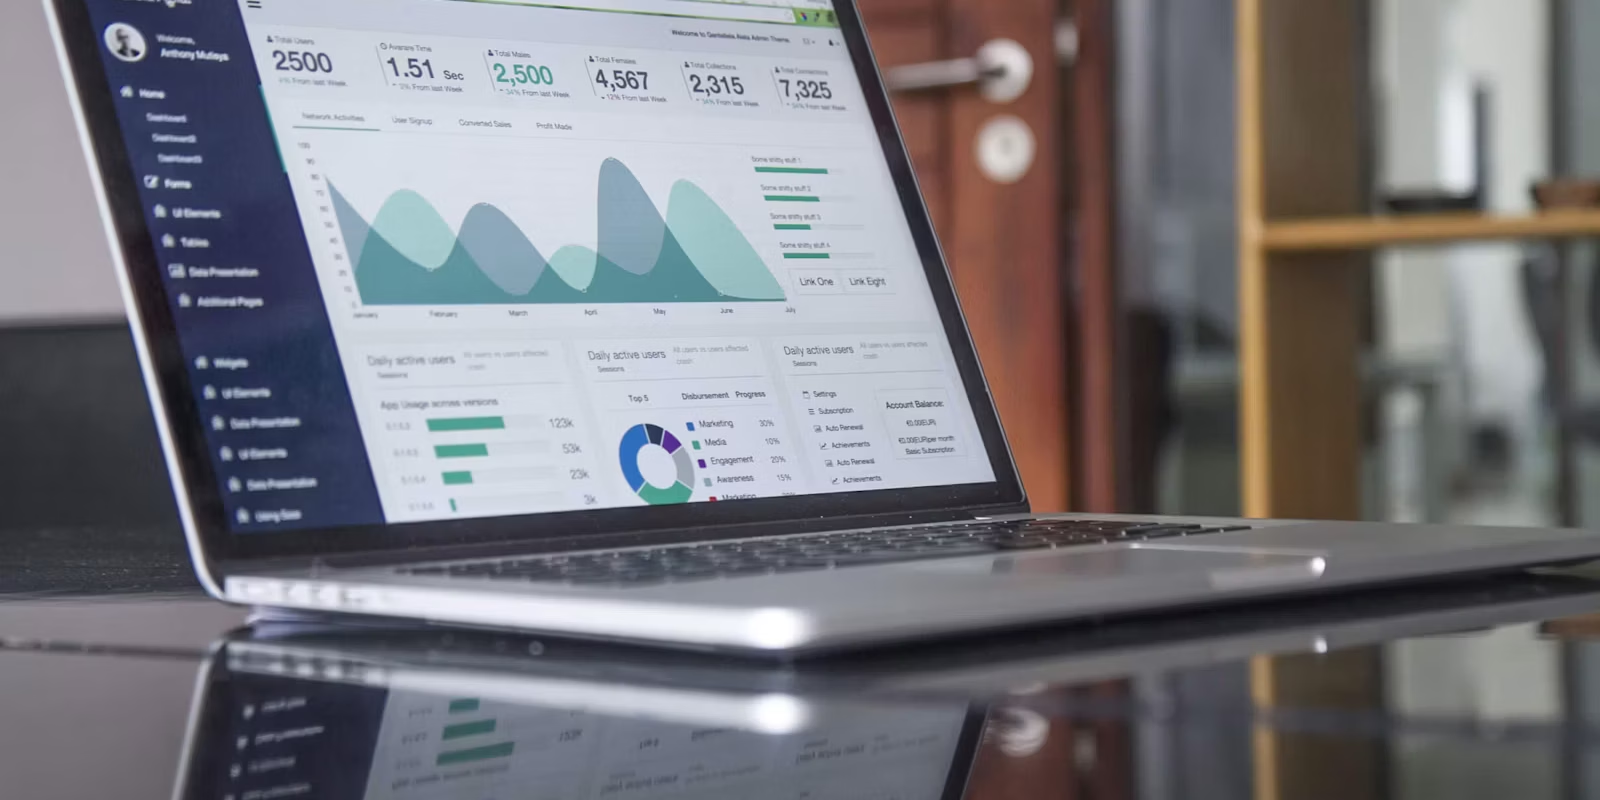
Occupancy, Labor & Margin in One View
Running an assisted living, memory care, or PACE program means balancing occupancy, staffing, safety, family expectations, and margin — often with siloed systems and yesterday’s spreadsheets.
Eldercare operational analytics transforms this chaos into clarity with an assisted living KPI dashboard that delivers predictive insights, so every leader starts the day knowing exactly where to focus.
What Assisted Living Analytics Delivers:
Unified Intelligence
One trusted view of your portfolio with clear next steps every day, built by integrating all your operational data sources.
Predictive Insights
Surfaces who needs attention, where costs are drifting, and which leads will convert — before problems escalate.
Proactive Care
Anticipate resident needs before challenges arise with predictive models for falls, transfers, and satisfaction.
Real-Time Action
Staff the next two weeks with confidence using automated forecasting aligned to acuity and census.

You Focus on Care, We Handle the Analytics
Your team deserves tools that support exceptional care delivery. Analytics should simplify your day, not complicate it. Enrich works quietly in the background, turning data into clarity — so you can focus on what you do best: providing compassionate, personalized care.
Challenges Assisted Living Analytics Solves
Modern assisted living analytics addresses the most pressing operational pain points facing senior care operators today.
Siloed Data Systems
Connect EHR, payroll, and census systems into one set of actionable insights instead of disconnected sources.
Reactive Decision Making
Predictive capabilities surface early warning signs so operators act proactively, not after the fact.
Occupancy Uncertainty
Forecast move-outs and identify at-risk residents before they leave your community and revenue is lost.
Manual Reporting Burden
Real-time dashboards replace hours of manual report building, freeing staff for resident care and strategy.
Staffing Inefficiencies
Forecast optimal staffing by unit and shift — no more over-staffing quiet periods or under-staffing busy ones.
Hidden Cost Leakage
Uncover discount overuse, agency overtime spikes, and billing errors that quietly erode margins.
Missed Quality Indicators
Surface falls, medication errors, and resident dissatisfaction in real time, before they escalate.
Limited Market Intelligence
Benchmark your performance against the market with competitive pricing insights and referral trends.
What Assisted Living Analytics Enables
Make better decisions faster with comprehensive eldercare operational analytics, an intuitive assisted living KPI dashboard, and memory care analytics.
Forecast Staffing Levels
Predict service demand by unit, shift, and acuity tier for optimal care coverage.
Operator Impact
Understand caregiver impact with outcome-linked performance metrics.
Sales & Marketing
Benchmark resident acquisition and funnel conversion metrics.
Pricing Strategies
Data-driven guidance for rate-lift and discount elasticity.
Social Connections
Engagement insights and isolation risk alerts.
Pre-Clinical Interventions
Support proactive care conversations with families.
Anomaly Detection
Falls spikes, agency surges, stalled leads, billing outliers.
Churn Prediction
Predict move-outs to protect occupancy and extend length of stay.
Memory Care Analytics
Track cognitive decline patterns, behavioral trends, and specialized care effectiveness.
PACE Program Optimization
Monitor participant utilization, IDT coordination, and dual-eligible enrollment.
Workforce Management
Optimize scheduling, reduce turnover, and track caregiver productivity.
Operational Benchmarking
Compare performance against regional and national eldercare benchmarks.
How Assisted Living Analytics Works
From data integration to daily insights — here’s how analytics transforms your operations.
Connect Your Data Sources
Securely integrate your EHR, payroll, billing, and census systems — the platform connects to the systems you already use.
Automated Data Processing
The analytics engine automatically cleans, standardizes, and harmonizes your data. No manual entry or cleanup.
Predictive Models Generate Insights
Algorithms analyze patterns to forecast staffing needs, predict move-outs, and identify quality risks.
Actionable Dashboards Delivered
Results appear in role-specific dashboards with clear action items — what matters most to each stakeholder.
Continuous Improvement
As you act on recommendations, the platform learns and refines its predictions over time.
The Power of Assisted Living Analytics
Measurable outcomes that demonstrate the ROI of assisted living analytics for senior care operators.
Increase Occupancy
Identify move-out risk early, review pricing strategies, and follow lead conversion from first inquiry to move-in.
Reduce Safety Incidents
Real-time alerts for fall risk, medication adherence, and resident behavior changes help prevent incidents before they occur.
Optimize Staffing
Accurate forecasts by shift, unit, and acuity level — match care minutes to resident needs instead of over- or under-staffing.
Improve Margins
Surface hidden cost leakage, review rate increases, and see which services carry the strongest margins.
Save Administrative Time
Automated refreshes replace manual spreadsheet assembly, so reporting time goes back to your team.
Improve Lead Conversion
Track every touchpoint in the sales funnel, identify bottlenecks, and score lead quality so sales focuses on high-intent prospects.
Enhance Resident Experience
Monitor engagement, social connection, and satisfaction trends for happier residents and longer stays.
Demonstrate Quality
Transparent, real-time quality metrics for families, surveyors, and boards build trust and support compliance.
See How You Stack Up Against Industry Peers
Compare your performance across 50+ KPIs with anonymous, aggregated data from comparable operators. See where you land in the distribution and prioritize the improvements that matter most.
KPIs Benchmarked
Benchmark Reports
Comparison Sets
Anonymous & Secure
Occupancy
Occupancy rate, ALOS, move-in velocity vs. peers
Staffing
Care minutes PPD, overtime %, turnover comparison
Quality
Falls rate, med-pass accuracy, response times
Financial
RevPOR, NOI margin, labor cost % benchmarks
Assisted Living Analytics Modules
Comprehensive coverage across every aspect of senior living operations including staffing, quality, sales, and finance.
Executive Command Center
- Portfolio rollups with drill-downs by region, campus, and unit
- Occupancy trend, rate realization, RevPAR/RevPOR, ALOS, and payer mix
- Early-warning panels: churn risk, agency spikes, discount leakage
Staffing & Workforce Intelligence
- Care minutes per resident day vs. acuity-aligned targets
- Overtime %, agency %, vacancy days to fill, competency compliance
- Two-week staffing forecast tied to census pipeline and care plans
Safety & Quality of Care
- Falls per 1,000 resident days with heat maps by unit/time/caregiver
- Change-in-condition and transfer risk flags; med-pass adherence trends
- Response-time monitoring and root-cause analysis
Sales & Marketing Performance
- Inquiry → Tour → Deposit → Move-In conversion by source and rep
- Cost per move-in; 12-month resident value by channel
- Competitive pricing positioning and waitlist velocity signals
Finance & Pricing Intelligence
- Room & board vs. services, rate-increase capture, discount corridors
- DSO, write-offs, payer profitability; service utilization and ancillary revenue
- Price-sensitivity modeling to guide market-aligned rate strategies
Comparative Benchmarking
- Peer-group comparisons across 50+ KPIs by geography, size, and acuity mix
- Percentile rankings: top 10%, 25%, median, or improvement areas
- Quarterly benchmark reports with prioritized improvement recommendations
Assisted Living KPI Dashboard Metrics
Industry-specific KPIs across assisted living, memory care, and PACE programs — all tracked in one Power BI-driven dashboard.
Occupancy & Revenue
Staffing & Labor
Safety & Quality
Sales & Marketing
Finance
Memory Care Metrics
PACE Program KPIs
Connect Enrich to the Systems You Already Use
Enrich sits on top of the technology you rely on every day — pulling data from your existing systems and turning it into clean, actionable insight. No new ecosystem required.
Financial & Accounting
HR & Payroll
Healthcare & EHR
CRM & Project Management
Marketing & Analytics
Communication Tools
Data Platforms
POS & Billing
Frequently Asked Questions
Everything you need to know about assisted living analytics, memory care analytics platforms, and senior living KPI dashboards.
Assisted living analytics is the practice of collecting, analyzing, and acting on data from senior care operations. Modern assisted living analytics platforms integrate data from multiple sources (EHR, payroll, census, billing) to provide predictive insights. Unlike traditional reporting, assisted living analytics uses machine learning to forecast trends, identify risks, and recommend actions before problems arise.
Ready to transform your operations with assisted living analytics?
Turn your senior living data into measurable results with predictive insights, built on Microsoft Power BI by a certified Microsoft Partner.