

Optimization of Data Model using Bridge Table
If you aim to establish a resilient and efficient data model within Power BI, comprehending and mastering bridge tables is essential. This article delves into everything you should know regarding bridge tables, encompassing their significance, a step-by-step guide on creating them, and suggestions for enhancing their performance and functionality. Upon completing this guide, you will possess the skills to adeptly utilize bridge tables, facilitating the construction of sophisticated data models with confidence and ease.
Overview
The word “bridge” has several meanings however in this context, a bridge is a structure that promotes/provides relations (pathways) between groups. As we know, there are instances in data of modelling where there is a need to connect two or multiple tables where there is no relationship, or a many-to-many relationship exists between them. The examples below portray these two instances
Instance I
Consider a scenario where you possess a student table, a course table, and a lecturer table, each equipped with distinct primary keys. While the student table includes a lecturer key and a course key, these keys do not align directly with the primary keys in the course and lecturer tables. In such a situation, it becomes imperative to introduce a bridge table that establishes a connection between the student table and the course and lecturer tables.
Instance II
In a scenario where you have a table of students and another of classes, a bridge table proves to be invaluable for establishing a connection between the two. This enables a clear representation of which students are enrolled in specific classes. The necessity arises from the fact that a student may be enrolled in multiple classes, and conversely, a class may have multiple students enrolled in it. Without the inclusion of a bridge table, accurately depicting this relationship within a data model would be challenging.
Importance of Bridge Table
Bridge tables are indispensable in data modelling as they empower the creation of intricate and versatile relationships between tables. The absence of bridge tables may impose limitations on the capabilities and functionality of your data model.
Moreover, these tables contribute significantly to maintaining referential integrity within your data model. Referential integrity guarantees the accuracy and consistency of relationships between tables, thereby averting data inconsistencies or errors.
In the context of many-to-many relationships between tables, bridge tables assume a pivotal role. They serve as connectors linking two tables with multiple records that can be associated. For instance, in a library database, a bridge table could establish a connection between the books table and the author’s table, accommodating scenarios where a book has multiple authors, and an author has authored multiple books.
Practice
In this section of the blog, we will go through the concepts in a hands-on approach to drive home these thoughts.
Connecting two tables that don’t have any existing connection (Instance I)
We have three tables: Students Table, Courses Table and Enrollments Tables. Tables 1, 2 and 3 provide a detailed description of these tables.
Table 1: Students Table
| StudentID | StudentName |
| 1 | John |
| 2 | Alice |
| 3 | Bob |
Table 2: Courses Table
| CourseID | CourseName |
| 101 | Math |
| 102 | English |
| 103 | History |
Table 3: Enrollments Table
| StudentID | CourseID |
| 1 | 101 |
| 1 | 102 |
| 2 | 101 |
| 3 | 102 |
| 3 | 103 |
In a proper analysis, there is a need to get students’ names and the courses they enrolled in a semester. This can only be achieved in this set-up if we use the enrollments table as a bridge to connect the students’ table and courses table. Let’s get this done on PowerBI.
Step 1: Open the PowerBI Desktop application on your PC
Step 2: Click “Get Data” to import these tables into the PowerBI environment.
Step 3: Go to the model view and create a one-to-many relationship between student Table and Enrollments Table. Create another one-to-many relationship between the course table and the enrollments table as shown in Figure 1.
Figure 1: The data view that shows the bridge table connecting student table and course table
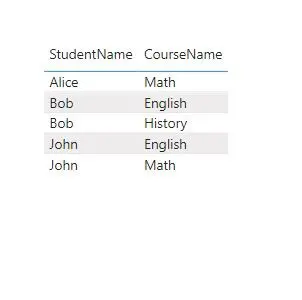
Step 4: Go to the report review and build a simple table visually using “StudentName” from Student Table and “CourseName” from Courses Table. Figure 2 displays the result obtained in the visualization.
Figure 2: A table that hold the result of all students and their enrolled courses
Instance II
We will be using a large data set to demonstrate how we can use a bridge table to connect two or multiple fact tables to optimize the data model. The dataset used in this scenario is the Northwind sales dataset. It is available in https://services.odata.org/V3/Northwind/Northwind.svc/
We have a scenario where we need to build reports using columns from the invoice table and the order table. We will use a build bridge table to connect these tables and other dimension tables to meet our requirements.
Step 1: Open the PowerBI Desktop application on your PC
Step 2: Click “Get Data” and navigate to the OData feed option to load the shared url
Step 3: Select the tables we need for this set-up: Customers, Employees, Invoices, Order_Details, Orders and Products.
Step 4: Click “Transform data” and carry out backend transformation on the data.
Step 5: Duplicate the “order details” table and select the following columns: OrderID and ProductID.
Step 6: Merge the table with the “orders” table by OrderID. Select the following columns: CustomerID and EmployeeID. Ensure to uncheck the column prefix option. Kindly apply the changes and close the power query environment.
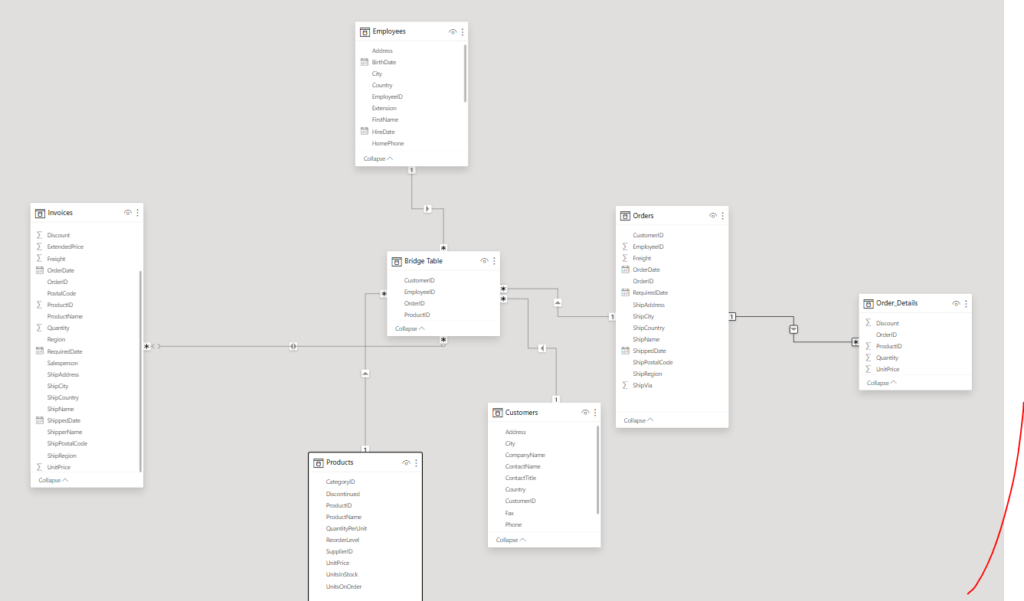
Step 7: Click “Model View” and establish the relationship between the bridge table and other tables as shown in figure 2.
This setup ensures that the circular dependency is eliminated.
In this piece, we introduce the concept of linking tables that do not have any relationship by using bridge table and optimizing the data model.