
Uncategorized

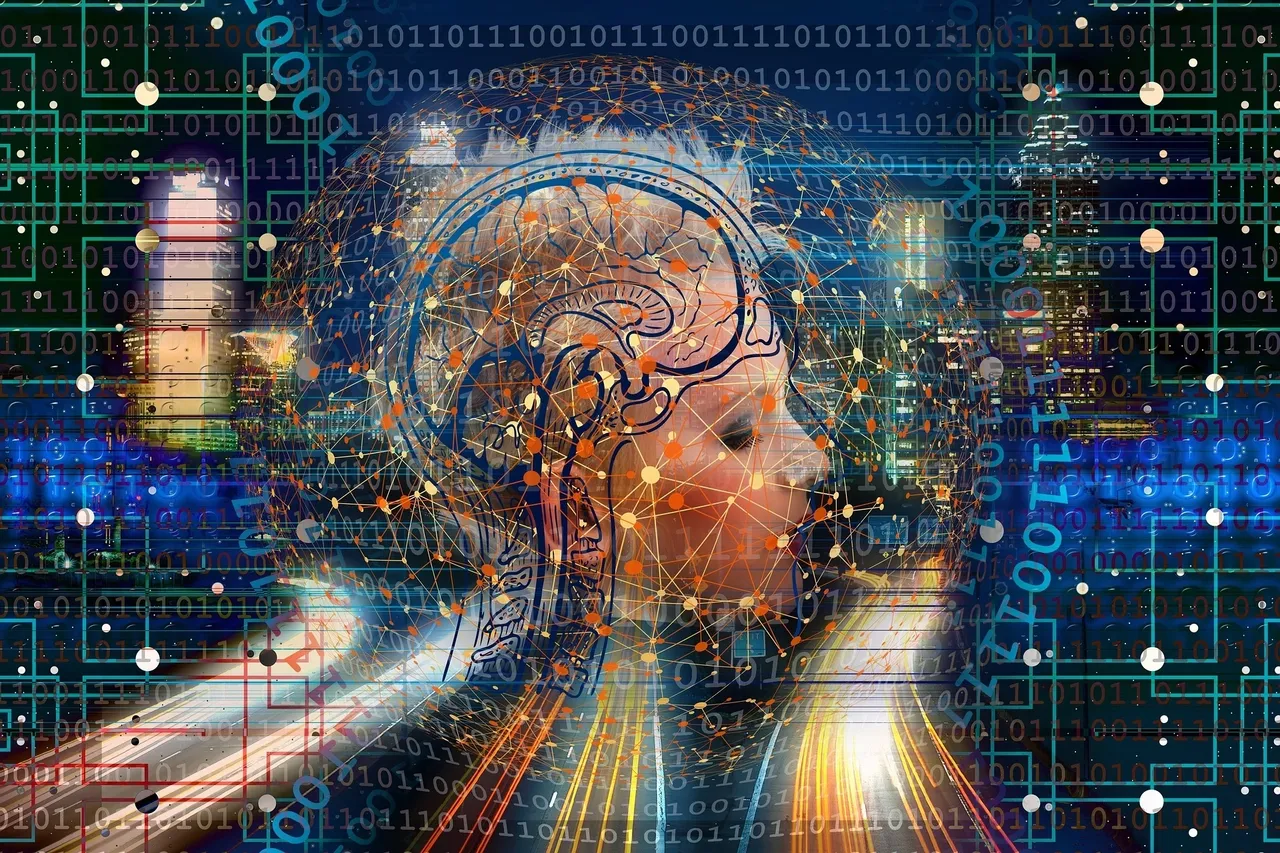
Three Eras of Intelligence
Navigating the Information Age: Three Eras of Intelligence The world…

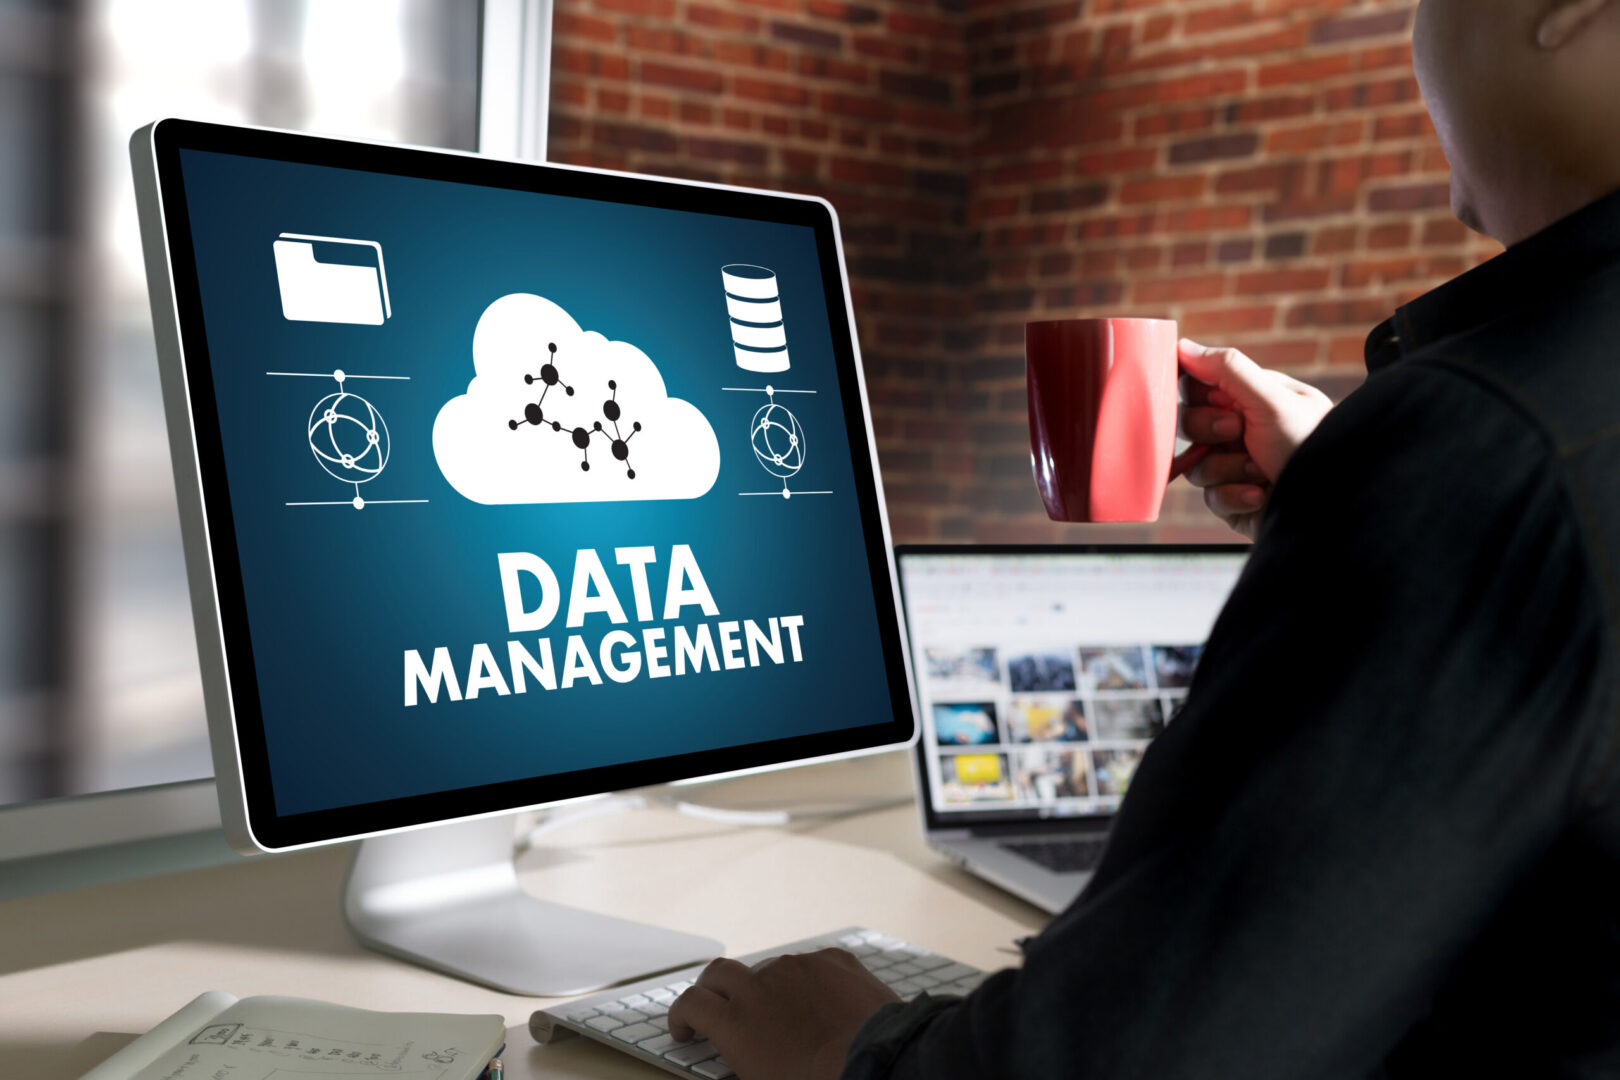
Data Engineering and Data Architecture
Overview “In the digital age, data is the new oil.…
TUTORIAL ON BOT DEVELOPMENT USING AMAZON LEX
Introduction Artificial intelligence (AI) has influenced our everyday activities by…

Top Five (5) Business Intelligence Tools: A Comparative Review
Introduction Business intelligence (BI) is a process that involves the…

PowerApps Benefits Outlined
Introduction As businesses move towards modernizing their operations, the demand…

Data Analyst Guide
Introduction The beginning of the year offers opportunities to start…
Data Warehouse
A Data Warehouse (DW) is a hub where data are…

Extract, Transform and Loading (ETL) Data Phase
Data Extraction After collecting/gathering data successfully from the different sources,…

Data Modelling
Data Modelling The first step of every database design project…
Analysis and Insight Data Phase
The final phase of the data cycle in any business…