
")
Calculated Columns and Measures
Calculated Column & Measures in Power BI: Understand the Difference
In Power BI, calculated columns and measures are two different types of calculations that you can create to enhance your data analysis and visualization. Understanding the difference between them is crucial for effective Power BI development.
Calculated Columns
Definition
Calculated columns are new columns that you add to a table in your Power BI model. These columns are computed row by row in the data model and then stored physically in the data storage. They are similar to calculated fields in Excel.
Use Cases
Calculated columns are useful when you want to create a new static column based on a formula that uses values from the existing columns of a table.
You can perform operations like concatenation, mathematical calculations, string manipulations, and date calculations in calculated columns.
Performance Impact
Calculated columns can impact performance, especially when dealing with large data sets because they increase the size of the data model.
Since calculated columns are precomputed and stored in the model, they consume memory and can slow down data refresh and report rendering.
Syntax Example
For instance, you can create a calculated column to calculate the total sales by multiplying the Quantity and Price columns:
`Total Sales = TableName[Quantity] * TableName[Price]`
Insights on Calculated Column
Row by Row Calculation
In most cases, the calculation when executing a calculated column is row by row across the table.
Stored in Memory
Calculated Column, like any other column, keeps values in memory. The calculation takes place during Refresh time, and the result is saved in memory. This means that the more computed memory you have, the more memory you will consume and the longer your refresh time will be. Nevertheless, because many calculations are simple, your refresh time may not be significantly impacted.
Calculated Column Challenges
Calculated columns in Power BI can be very useful for certain scenarios, but they can also introduce challenges if not used carefully. Here are some common problems associated with calculated columns:
Performance Issues
Calculated columns can significantly impact performance, especially with large datasets. Since they are computed and stored in the data model, adding too many calculated columns can increase the size of the model, making it slower to refresh and render visualizations.
Memory Consumption
Calculated columns consume memory in the data model. With many calculated columns, your Power BI file size can grow substantially, potentially leading to memory limitations, especially when sharing reports online or via email.
Data Refresh Time
Each time your data source is refreshed, calculated columns are recalculated. If you have complex calculations in your calculated columns or many rows, this can greatly increase the time it takes to refresh your data.
Difficulty in Debugging
Debugging calculated columns can be challenging, especially when dealing with complex formulas. Unlike measures, you can’t easily see the result of a calculated column in the context of a visualization.
Limited Aggregation
Calculated columns operate on a row-by-row basis, limiting their ability to perform aggregations or calculations that require context from multiple rows or tables. Measures are more suitable for these types of calculations.
Static Nature
Calculated columns are static and do not change based on user interactions with the report. This lack of interactivity can limit the dynamic nature of your reports.
Best practices when creating calculated columns
Use Measures for Aggregation
For calculations that involve aggregation, totals, averages, etc., it’s best to use measures. Measures are calculated dynamically based on the context of the visualizations, leading to better performance and interactivity.
Limit the Number of Calculated Columns
Avoid creating a large number of calculated columns. Evaluate if a calculated column is necessary, or if the same result can be achieved with a measure.
Optimize Formulas
Write optimized formulas to minimize the computational load on calculated columns. Complex calculations and nested functions can slow down performance.
Regularly Review and Clean Up
Periodically review your calculated columns and remove any that are no longer necessary. Unused or redundant calculated columns can clutter your data model.
Measures
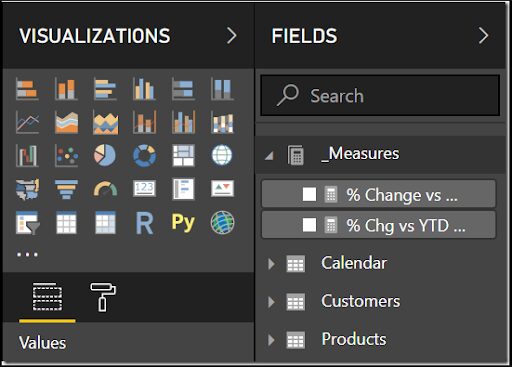
Definition
Measures are calculations that are created in the context of a visual (like charts, tables, or matrices) and are based on the aggregated data. Measures are dynamic and are not stored in the data model; instead, they are calculated on the fly when a user interacts with a visualization.
Use Cases
Measures are useful for creating aggregations, summaries, and complex calculations based on the data in your model. Measures are essential for creating key performance indicators (KPIs) and performing aggregate calculations like sum, average, minimum, maximum, etc.
Performance Impact
Measures do not have a significant impact on performance because they are not precomputed or stored in the model. They are calculated on-demand when a user interacts with the report.
Syntax Example
A measure for calculating total sales might look like this:
`Total Sales = SUM(TableName[Sales])`
Calculated Measure Challenges
While measures in Power BI offer a lot of flexibility and interactivity, there are still some disadvantages and limitations to be aware of:
Performance Impact with Complex Measures
Complex measures involving multiple DAX functions and large datasets can impact performance, especially in reports with numerous visuals. It’s essential to optimize DAX calculations for better performance.
Limited to Visual Context
Measures operate in the context of the visualizations where they are used. If you need to use the same measure in different contexts, you might need to create multiple measures with slight variations, leading to potential confusion and maintenance challenges.
Limited to Single Table Context
Measures are generally defined within a single table context. While relationships can be established between tables, creating measures that require context from multiple related tables can be complex and may require advanced DAX knowledge.
Not Suitable for Row-Level Calculations
If you need to perform calculations at the individual row level (e.g., flagging specific rows based on conditions), measures are not the right tool. Calculated columns are more appropriate for row-level calculations.
Limited to Aggregations
Measures are designed for aggregations (sums, averages, counts, etc.) and calculations based on these aggregations. They are not well-suited for certain advanced statistical operations or calculations requiring granular row-level data manipulation.
Difficulty in Debugging Complex Measures
Debugging complex measures can be challenging due to the nested nature of DAX functions. It might be difficult to pinpoint errors or unexpected behavior in intricate measure logic.
Limited to Data Model
Measures are limited to the data available in the data model. They cannot directly access data from external sources or perform operations involving external data outside the data model.
Not Suitable for Data Transformations
Measures cannot be used for data transformation tasks like those performed in Power Query. If your calculations require data cleansing, transformation, or merging, you should use Power Query transformations before loading the data into the mode.
Key Differences
Storage
Calculated columns are physically stored in the data model, whereas measures are calculated on the fly and not stored.
Context
Calculated columns are computed in the context of the entire table row by row. Measures are computed in the context of the visual elements (like charts) and their interactions.
Aggregation
Calculated columns work with individual row-level data, while measures work with aggregated data.
In summary, calculated columns are static and stored in the model, while measures are dynamic and calculated at runtime based on the context of the visualizations. Understanding their applications and limitations helps in making informed decisions about whether to use measures or explore other options, such as calculated columns or Power Query transformations, depending on your specific requirements and the complexity of your data analysis tasks.