

Mid-Year Reporting Benefits
Everyone loves the summertime. This includes business owners or executives. Why do you love it? Maybe the day trips to the beach, the chance to spend time with family and friends, longer days, the time off school for the kids or the blue skies. While this season offers us diverse possibilities to build great memories, it is one of the best times to sit down and evaluate your progress from the previous six months and devise a new scheme to achieve your yearly goals. According to a study by the Gartner Group, only 13% of businesses meet their yearly strategic goals while another study revealed that only 65% of small business owners met more than half of their objectives in 2021. Conducting a mid-year financial review can align your business objectives to achieve its goals.
In this piece, we mention all the reports in your business that you should access for their January-June performance as well as a closer look at how to carry out a mid-year financial review.
Certainly! While these reports can vary depending on the industry and the nature of the business, here are the reports the business should review at the midpoint of the year:
- Financial Statement
- Sales and Revenue Analysis
- Customer Satisfaction and Feedback
- Marketing Campaign Analysis
- Inventory and Supply Chain Analysis
- Competitive Analysis
- Employee Performance, Operational Efficiency and Process Improvement
Let’s focus on the mid-year financial review, sales and revenue analysis and customer satisfaction and feedback in this piece.
Mid-Year Financial Review
The mid-year financial review of your business will demand you draw up your first six-month income statement. The income statement comprises the following components: revenue, expenses, operating income and others as expressed in the template shown in Table 1. The income statement will provide a financial summary of your performance in the reporting period. This document can help business owners and other stakeholders identify current profitability or net loss. The revenue section will capture all the revenues (sales, commission, advertisements, licensing, subscriptions, consulting, royalty, and investment) that have been generated by the business. Specifying the revenue type will give the stakeholders a clue about where the gold is been mined. All expenses must be categorized and reported on the income statement. There is a need to categorize the expenses into operating expenses (OPEX) and capital expenditures (CAPEX). OPEX includes employee salaries, rent, and utilities while CAPEX includes physical assets like buildings, equipment, machinery and vehicles.
You can decide your cash flow by subtracting the total expenses from your income to evaluate if you are on the green side of the balance sheet. If you are on the red side of the balance sheet, then there is a need to reevaluate some key decisions you made at the start of the business year.
Table 1: A simple cash flow statement for company XYZ.
| Revenue | |||
| Operating Income | Sales Revenue | X | |
| Other Revenue | X | ||
| Others | Interest Income | X | |
| Total Revenue | X | ||
| Expenses | Operating Expenses | Salaries and Wages | X |
| Rent and Utilities | X | ||
| Marketing Expenses | X | ||
| Office Suppliers | X | ||
| Depreciation | X | ||
| Other Expenses | Cost of Gods Sold | X | |
| Interest Expenses | X | ||
| Income Tax Expenses | X | ||
| Total Expenses | X | ||
| Net Income | X |
Sales and Revenue Analysis
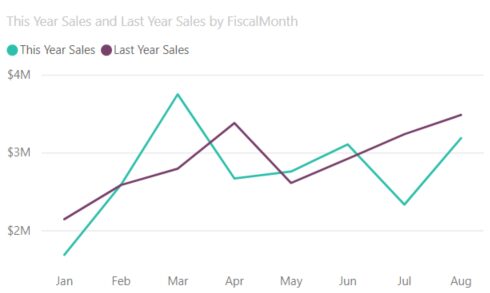
Figure 1: A plot of line charts that displays Company XYZ this year and last year sales performance by fiscal month
With the application of data visualization and forecasting, business owners can perform mid-year reporting on their sales and revenue performance. Sales and revenue analysis entails the examination and interpretation of data related to sales and revenue to gain insights into the financial health and effectiveness of a business. To effectively perform this analysis, sales data such as sales figures, revenue records, customer data, pricing information, marketing expenses, and any other relevant financial data must be collected.
Here are the possible analyses that can be performed on the sales data:
Sales Analysis
- Sales Volume: Analyze the number of units sold or services rendered during the selected period.
- Sales Trends: Identify any patterns or trends in sales data to understand seasonality or long-term changes.
- Sales by Product/Service: Break down sales figures by different product or service categories to identify top-performing and underperforming offerings.
- Sales by Region/Market: Analyze sales performance in different regions or markets to identify areas of strength and areas for improvement.
Revenue Analysis
- Total Revenue: Calculate the total revenue generated during the selected period.
- Revenue by Product/Service: Determine the revenue contribution of each product or service category.
- Revenue by Customer: Analyze revenue generated from different customer segments to identify high-value customers and potential growth opportunities.
- Revenue Trends: Look for patterns in revenue data to understand the impact of marketing efforts or changes in the business environment.
Customer Sales Behavior
- Study customer behavior, preferences, and demographics to target marketing efforts effectively and enhance customer satisfaction.
- Top 10 customers by amount spent
- Top 10 customers by sales count
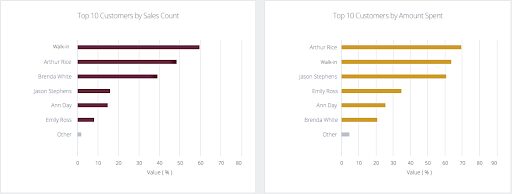
Figure 2: Top 10 customer reports presented in two bar charts.
The actionable insights business stakeholders can obtain from the above reports are to develop strategies for increasing sales, improving revenue, and optimizing overall business performance.
Customer Satisfaction and Feedback
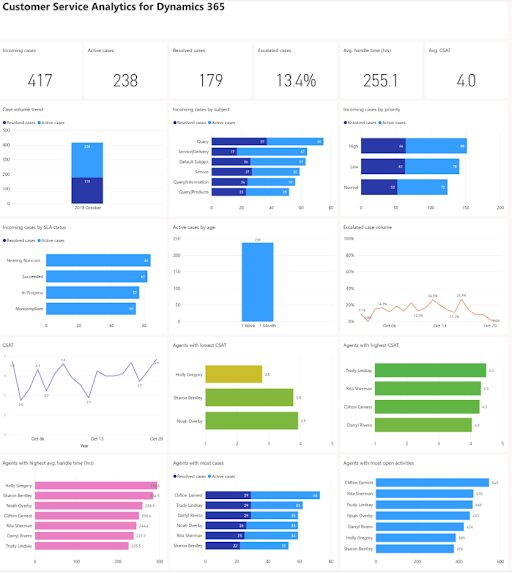
Figure 3: Customer Service Dashboard for Dynamics 365
Evaluating and interpreting customer feedback and data to access customer satisfaction toward your company’s products, services, and overall customer experience is pivotal for your business. This analysis aids business stakeholders with valuable insights into how customers perceive their business and identifying pain points that when addressed can improve the customer-client relationship within the business. To optimally perform this analysis, customers’ feedback data are collected via various channels (surveys, feedback forms, online reviews, and customer support interactions).
Here are the possible analyses for the customer data:
Customer Service Analysis
- Conversion Rate – A measure of how successful your sales effort matches prospects’ progress down the funnel to paying customers. Learn more about customer acquisition [link]
- Customer Lifetime Value (CLV) – To determine the expected net profit generated from a customer throughout their entire relationship within a business/company.
- Customer Effort Score (CES) – A metric that captures how much effort a customer service resolve an issue, a request fulfilled, a product purchased/returned, or a question answered.
- Customer Satisfaction Score (CSAT) -This KPI indicates how satisfied customers are with the company’s products or services. It is usually expressed as a percentage (100% would be fantastic – 0% would be terrible)
- Average Resolution Time – The average time it takes for customer support to resolve a ticket.
- Net Promoter Score (NPS) – This metric evaluates customer loyalty, satisfaction and enthusiasm for a company. This KPI is computed by asking customers one question: “On a scale from 0 to 10, how likely are you to recommend this product/business to a friend or colleague? Learn more about NPS [link]
- Customer Churn Rate – This measures the rate at which customers stop doing business with a company over a defined timeframe
- Customer Purchase Behavior – This identifies how your customers decide on a product or a service.
The actionable insights business stakeholders can obtain from the above reports are to develop an action plan and timeline for implementing improvements based on the insights. Assign responsibilities to team members and monitor progress.
Conclusion
With the use of visualization tools like line charts, business stakeholders can identify emerging patterns that could be because of customer behavior shifts, government policy, and market demands. Spotting these hidden patterns within your data can help the business move towards its yearly goals. Innovation and growth opportunities are steppingstones for businesses if they can recognize and maximize them to the fullest. Mid-year reporting sessions are the perfect time to think out of the box. New product development or expansion into untapped markets could be what a business needs to turn the corner.
Take out time in this session to perform a mid-year report assessment on your business. This exercise could be the platform to pinpoint serious pain points, spot opportunities and make the necessary changes that will act as a springboard to reach heights that exceed your business goals and expectations.